![stoneridgeapp.png]](https://www.stoneridge.app/hs-fs/hubfs/stoneridgeapp.png?height=50&name=stoneridgeapp.png)
Pre-Requirements:
- MKII system
- FA-470 assigned to the truck and communicating with Stoneridge Server
- Note the automated feature will scan the last 24 hours three times a day and update logs
The portal will reference the registration and activation of a MirrorEye system for event creation. All logs prior to the completion of the activation will NOT be published to the portal or asset
-
- When the technician submits the activation ticket, the system will set this as Activation TIMESTAMP, and the feature will filter errors/dtcs sent after this timestamp to generate events.
- The go-live date of "launch" is February 21, 00:01 UTC. no logs before this date will be published to the portal.
- URL and Site Access
The site is designed to log a user out after 60 minutes of inactivity. Returning to the page may require you to login.
If you need access, please open a ticket with Stoneridge Technical Support 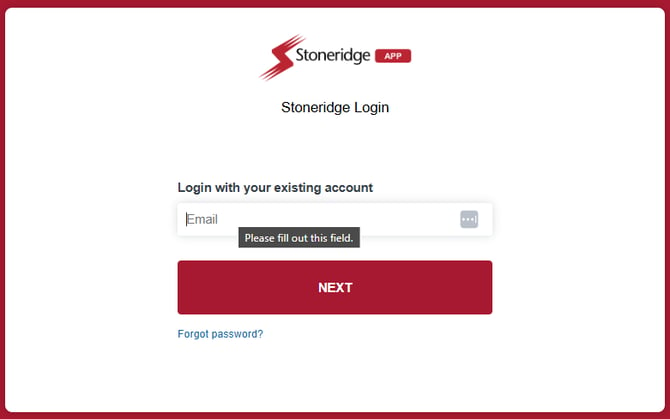
Home Page

-
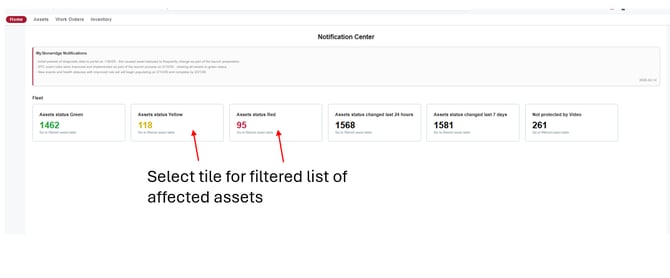
- Fleet Dashboard displays an overview of all registered systems and health status. System software version adds factors to the reporting and the system's ability to self-recover.
- Data service collects and filters all vehicle logs 3 times per day and sets the asset status based on reported errors if any and categorize based on severity and expected symptom related to an error.
- RED - Severity 1 reported errors affect performance and/or video flow services, system needs inspection and service
- YELLOW - Severity 2,3 or 4 - lower priority error, should be looked into but not urgent. Some situations errors can affect video flow service.
- Data service collects and filters all vehicle logs 3 times per day and sets the asset status based on reported errors if any and categorize based on severity and expected symptom related to an error.
- Fleet Dashboard displays an overview of all registered systems and health status. System software version adds factors to the reporting and the system's ability to self-recover.
-
-
- From the Home Page select the tile of filtered assets for the list view
-
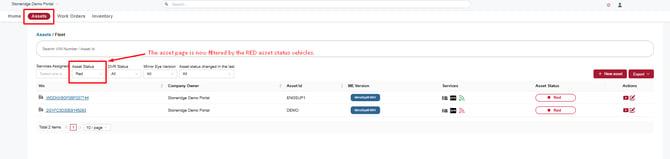
When the tile is selected, the page will refresh to the Assets list. You can also change the filter in the drop down on Asset page to view list of other SEV categories.
Asset Screen
Columns of data:
- Event ID - this is the number of records, not an error or DTC number
- Event Creation, First and Last time detected - When the error event was created on the asset, first and last time reported in the log. This can help identify intermittent conditions.
- Severity - auto status based on reported error. The status can be GREEN, YELLOW OR RED this status updates when reported events are resolved and validate health is ran to clear the event and scan for any remaining records.
- Status - information of record
- Action - resolution, this step can be performed from this list view or individual error view. Multiple error records can be selected and resolved together however are completed slightly differently.
- The column Asset Status is automatically updated based on MirrorEye system health and reported errors.
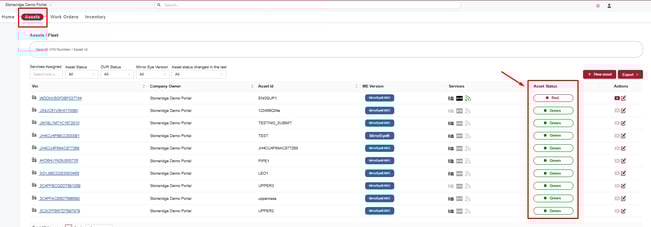
If no errors are reported in the log files, then the asset status will be displayed as GREEN, resolving errors and validating system health covered below.
-
- To view details of reported error you click the now "button" for the vehicle asset status

- To view details of reported error you click the now "button" for the vehicle asset status
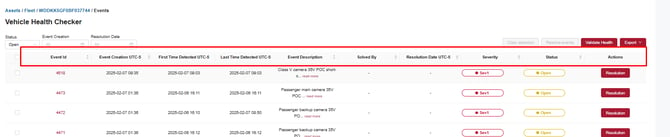
- The asset log will refresh displaying all logged errors for the asset
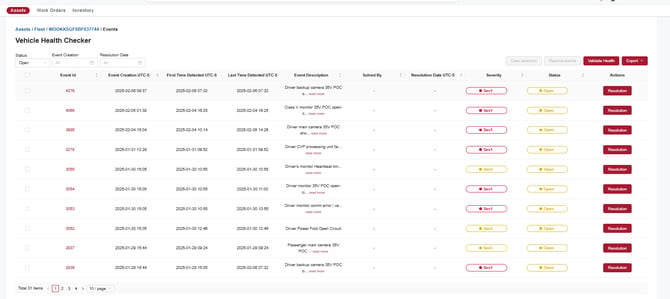
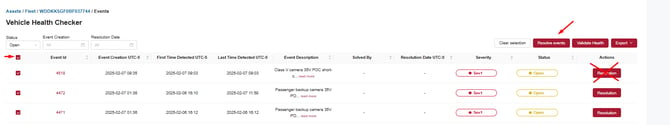
Vehicle Health Checker Page
-
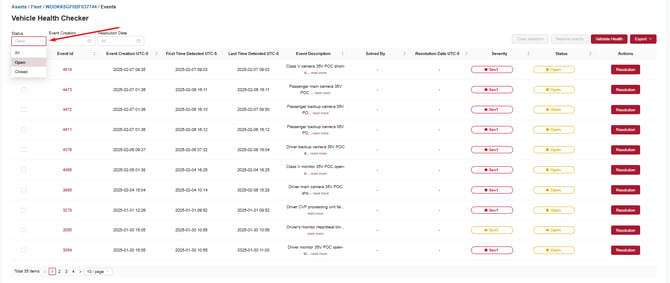
- When navigating into the Vehicle Health Checker you can filter on all, open, or closed errors for vehicle history.
- to view current or open errors, set filter to OPEN
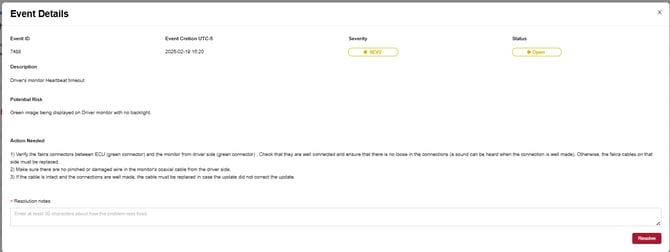
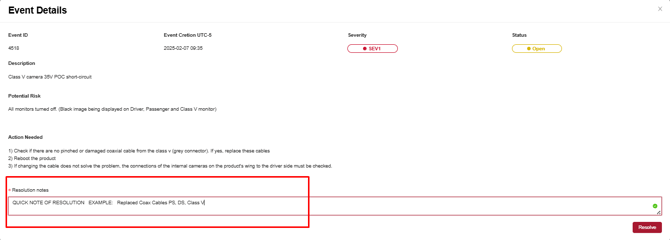
To view the detail of any listed event, click anywhere on the line, this will open the detail screen
- Error Description
- Expected symptom
- Actions needed to resolve or troubleshoot. some items will direct to known knowledge base articles for detailed direction
- Resolution if clearing individual events
CLEARING LOGGED EVENTS AND RE SCANNING
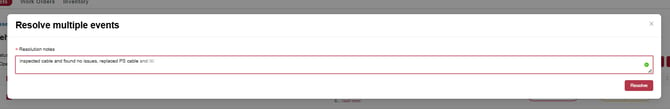
TO RESOLVE MULTIPLE EVENTS TOGETHER
Select the top box in the far left above the individual selections for the select all option.
Enter in resolution notes and select Resolve
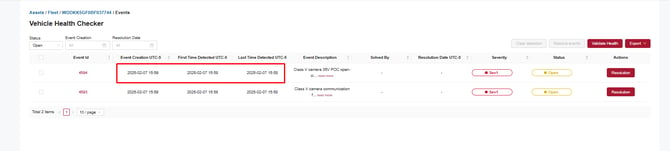
The page will refresh and automatically run the on-demand health checker. Please be advised that you will need to perform a key cycle of the system and run the health checker a 2nd time.
To resolve single or a select group of
vehicle health runs automatically and rescans the system, be advised the coverage area and communication strength can affect the data load to the portal. Some cases there may be a delay if the log refresh.
If any error return present new events will be generated with current time stamps.
Viewing history of events on any asset can be accessed by setting the filter to closed events

Release 02/2025 Revision xx/xx/xxxx